That is especially true once we move beyond the most optimistic scenarios.
An analyst may say:
“we assume MAR,”
“we used multiple imputation,”
or “the model handled missingness appropriately.”
But the deeper question remains:
what happens if that assumption is wrong?
That is where sensitivity analysis for missing data becomes essential.
Sensitivity analysis asks how much the conclusion changes when we vary assumptions about the missingness process, especially when MNAR is plausible.
This matters because in real-world data, missingness can reflect:
dropout,
severity,
treatment response,
workflow failure,
or selective follow-up.
In those settings, a single missing-data analysis is often not enough.
This post introduces:
why sensitivity analysis is necessary,
the logic of pattern-mixture and selection models,
delta-adjustment style analyses,
how to vary MNAR assumptions,
and how to interpret whether conclusions are robust or fragile.
Sensitivity analysis matters because the biggest risk in missing-data work is not only missing values, but overconfidence in assumptions that were never truly testable. ## Missing Data Assumptions Are Often Working Assumptions, Not Facts
A major challenge in missing-data analysis is that the mechanism is only partially observed.
We may have evidence that missingness is related to:
baseline severity,
age,
site,
treatment group,
or observed outcomes.
That can make MAR plausible as a working assumption.
But it rarely proves MAR.
And it certainly does not rule out MNAR.
This is why missing-data assumptions should often be treated as modeling choices rather than established truths.
Sensitivity analysis begins by taking that uncertainty seriously. ## Sensitivity Analysis Asks How Fragile the Result Is
The main question of sensitivity analysis is not:
what is the one correct answer?
It is:
how much does the answer change when we vary assumptions that cannot be directly verified?
That is a very different question.
Instead of pretending the missing-data mechanism is known, sensitivity analysis maps out a range of conclusions under different plausible scenarios.
This is especially valuable in high-stakes settings where decision-makers need to know whether the result is:
stable,
moderately assumption-dependent,
or highly fragile.
That makes sensitivity analysis a trust-building tool, not just a technical appendix. ## Clinical Dropout Is a Classic Setting Where Sensitivity Matters
To make the problem concrete, we will simulate a simple clinical trial style example with outcome dropout.
The outcome might represent:
symptom improvement,
quality-of-life score,
or a continuous clinical response measure.
We will compare treatment groups and then ask how the result changes under different assumptions about the missing outcomes.
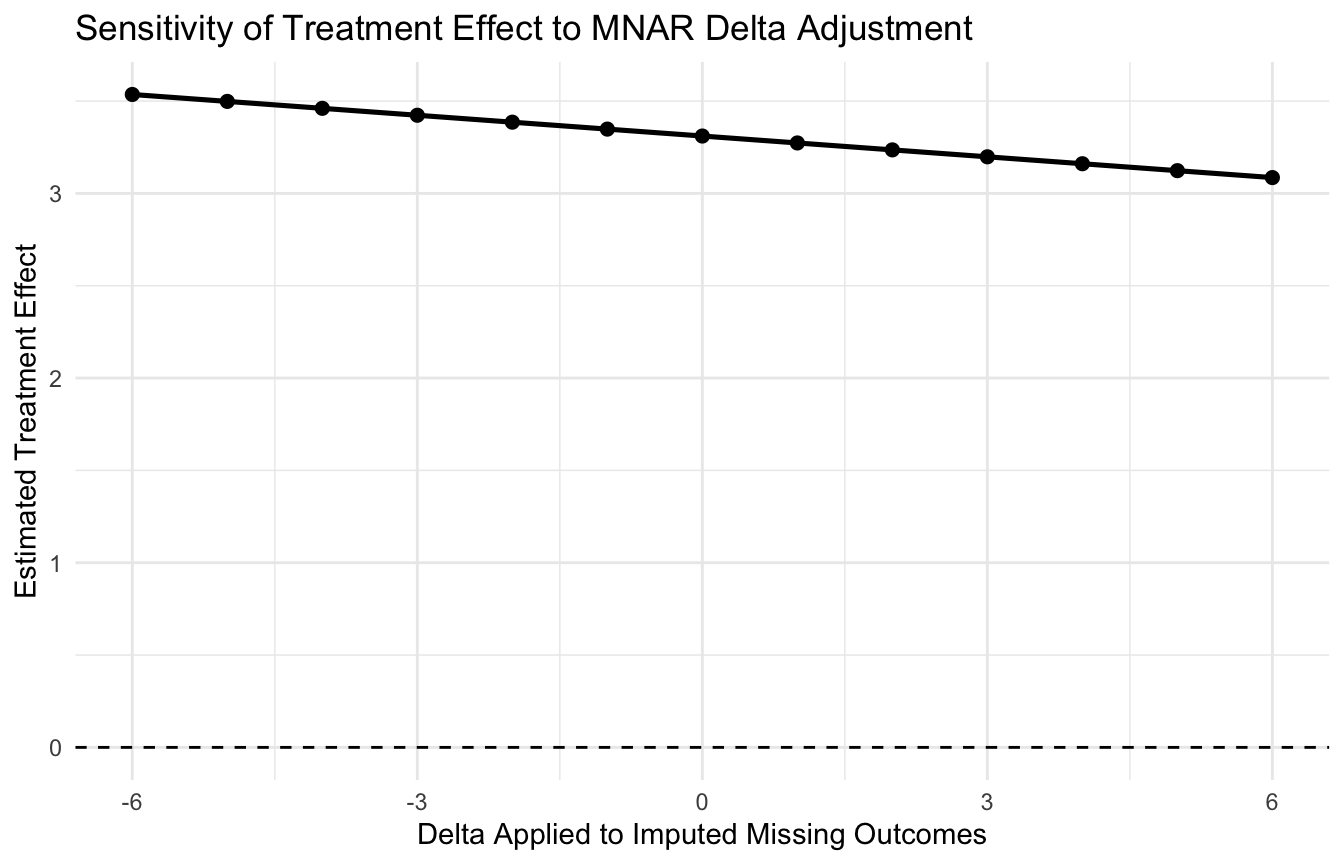
This is one of the most direct ways to show how conclusions depend on assumptions about the unseen outcomes. ## Plotting the Sensitivity Curve Is Often the Most Effective Summary
A plot usually communicates the sensitivity story better than a table alone.
ggplot2::ggplot(delta_results, ggplot2::aes(x = delta, y = treatment_effect)) + ggplot2::geom_line(linewidth =0.9) + ggplot2::geom_point(size =2) + ggplot2::geom_hline(yintercept =0, linetype =2) + ggplot2::labs(title ="Sensitivity of Treatment Effect to MNAR Delta Adjustment",x ="Delta Applied to Imputed Missing Outcomes",y ="Estimated Treatment Effect" ) + ggplot2::theme_minimal()
This plot answers an important practical question:
how extreme would the MNAR departure need to be before the conclusion changes materially?
That is often more useful than arguing abstractly about whether MAR is “true.” ## Pattern-Mixture Models Organize Sensitivity by Missingness Pattern
One major class of sensitivity methods is the pattern-mixture model approach.
The core idea is to stratify or conceptualize the data by missingness pattern and then model the outcome distribution within those patterns.
In practice, this often means:
model observed outcomes,
then impose offsets or shifts for the missing-pattern group,
and examine how results change.
Delta adjustment is often a simple applied version of this logic.
Pattern-mixture thinking is useful because it directly acknowledges that the distribution of missing outcomes may differ from the distribution of observed outcomes.
That is one of the most intuitive ways to encode MNAR departures. ## Selection Models Take a Different View of MNAR
A second major class is the selection model framework.
Here, the analyst models:
the outcome distribution,
and the missingness mechanism itself,
with the missingness probability depending directly on the possibly unobserved outcome.
Conceptually, this is a very natural way to represent MNAR.
But in practice, selection models are harder to identify and often require stronger assumptions.
That is why they are powerful but also more technically demanding.
For many applied blog-style examples, the pattern-mixture route is easier to communicate. ## A Simple Selection-Model Style Thought Experiment Helps
Even without fully fitting a formal selection model, it helps to think in its logic.
Suppose the probability of dropout is higher when the true outcome is poor.
Then the observed cases may systematically overrepresent better responders.
That means:
complete-case means may be inflated,
MAR-based imputations may still be optimistic,
and treatment effects may look stronger than they really are.
Selection-model thinking helps clarify that missingness can be outcome-driven in ways the observed data alone cannot fully resolve.
That is exactly why sensitivity analysis is needed. ## “Tipping Point” Analysis Is a Practical Communication Tool
A useful applied way to present sensitivity analysis is with a tipping point idea.
The question becomes:
how far would the missing outcomes need to deviate from the MAR prediction before the substantive conclusion changes?
This is often much easier for collaborators to understand than abstract missing-data taxonomy.
For example:
if the treatment remains favorable unless the missing outcomes are implausibly worse, the finding may look robust
if a small deviation reverses the conclusion, the finding may look fragile
This is one of the most communication-friendly reasons to do sensitivity analysis. ## Trustworthy Prediction Also Needs Missingness Sensitivity
Sensitivity analysis is not only for classical treatment-effect inference.
It matters in AI/ML too.
For predictive models trained on incomplete data, the missingness assumptions can affect:
feature distributions,
subgroup representation,
calibration,
and out-of-sample robustness.
In high-stakes settings such as drug efficacy modeling or healthcare risk prediction, it is not enough to say:
“we imputed the data”
The deeper question is:
how much does model performance or prediction shift under alternative plausible missingness scenarios?
That is the predictive analog of inferential robustness. ## A Simple Predictive Sensitivity Example Can Be Framed Similarly
One practical ML-style strategy is:
impute training data under a baseline assumption
refit the predictive model
perturb the imputed values under alternative MNAR deltas
refit again
compare performance or predictions
This can show whether the model is:
robust to missingness assumptions,
or highly assumption-sensitive.
The principle is the same as in treatment-effect sensitivity analysis, but the target becomes predictive performance rather than a regression coefficient or mean contrast. ## Sensitivity Analysis Does Not Prove the Truth — It Maps the Consequences
A very important point is that sensitivity analysis does not tell us which MNAR scenario is correct.
Instead, it tells us:
what would happen if the missing-data assumptions were wrong in specific ways.
That is still extremely valuable.
In practice, the goal is often not to prove a hidden mechanism. It is to understand whether the result depends precariously on unverifiable assumptions.
This is why sensitivity analysis should be viewed as a robustness tool, not as a truth machine. ## Clinical Judgment Should Help Set Plausible Sensitivity Ranges
One of the best uses of domain expertise is in choosing plausible sensitivity parameters.
For example, in a clinical trial:
how much worse might dropout patients realistically be than those retained?
could missing outcomes plausibly be 2 points lower?
5 points lower?
10 points lower?
These are not purely statistical questions.
Sensitivity analysis is strongest when the range of assumptions is informed by real-world subject-matter knowledge rather than arbitrary numeric variation alone.
That is one reason collaborative interpretation matters so much. ## A Practical Table Can Summarize Robustness Categories
It can help to summarize scenarios in plain language.
# A tibble: 13 × 3
   delta treatment_effect interpretation
   <dbl>            <dbl> <chr>
 1    -6             3.54 Treatment still favorable
 2    -5             3.50 Treatment still favorable
 3    -4             3.46 Treatment still favorable
 4    -3             3.42 Treatment still favorable
 5    -2             3.39 Treatment still favorable
 6    -1             3.35 Treatment still favorable
 7     0             3.31 Treatment still favorable
 8     1             3.27 Treatment still favorable
 9     2             3.24 Treatment still favorable
10     3             3.20 Treatment still favorable
11     4             3.16 Treatment still favorable
12     5             3.12 Treatment still favorable
13     6             3.09 Treatment still favorable
A table like this can support a narrative such as:
“The treatment effect remained positive unless missing outcomes were assumed to be at least 4 points worse than the MAR prediction.”
That kind of sentence is often far more useful than reporting a single imputed estimate alone. ## A Practical Checklist for Applied Work
Before reporting a missing-data sensitivity analysis, ask:
What is the primary result under the working missingness assumption?
What missing-data assumption is least defensible or most uncertain?
What alternative MNAR scenarios are clinically or operationally plausible?
Would a delta-based pattern-mixture analysis answer the main robustness question?
Does the conclusion change gradually or abruptly across scenarios?
Can I identify a tipping point?
Does the audience understand what is being varied and why?
These questions often determine whether the sensitivity analysis is truly useful or just decorative.
NoteWhere This Shows Up in AI/ML
FDA guidance on AI/ML-based software as a medical device now explicitly recommends sensitivity analyses for missing data assumptions, yet nearly no published trauma AI model reports a tipping point analysis. For a DoDTR mortality model, the relevant question is: how extreme must the MNAR mechanism be — how much sicker must the patients with missing prehospital vitals actually be — before the survival advantage attributed to a treatment protocol reverses? Without this analysis, the model’s conclusions rest on an untested MAR assumption that combat casualty data almost certainly violates. Sensitivity analysis does not require certainty about the mechanism; it requires honesty about the range of mechanisms consistent with the observed data.
Closing: Sensitivity Analysis Replaces False Certainty with Structured Honesty
Sensitivity analysis for missing data is important because it acknowledges a fundamental reality:
some of the most important assumptions in missing-data work are not directly testable from the observed data alone.
Rather than pretending otherwise, sensitivity analysis asks how much the result depends on those assumptions.
Pattern-mixture approaches, selection-model thinking, and delta-adjusted scenarios all serve the same broader goal:
to reveal whether the result is robust,
moderately dependent on assumptions,
or highly fragile.
Sensitivity analysis matters because trustworthy conclusions do not come from pretending missing-data assumptions are certain, but from showing how the answer changes when those assumptions are allowed to move.
This post is part of the Missing Data Toolkit — a companion reference with delta adjustment templates, tipping-point analysis code, pattern-mixture sensitivity grids, and reviewer-facing robustness language.
Carpenter, James R., Melanie Smuk, Tim P. Morris, and Michael G. Kenward. 2021. “Missing Data: A Statistical Framework for Practice.”Biometrical Journal 63 (5): 915–47. https://doi.org/10.1002/bimj.202000196.