# Simulate: CPG compliance rate as a function of data lag
n_weeks <- 52
true_rate <- 0.78 + 0.004*1:n_weeks + rnorm(n_weeks, 0, 0.03)
# Dashboard with 2-week lag always shows stale data
lag_weeks <- 2
dashboard_rate <- c(rep(NA, lag_weeks), true_rate[1:(n_weeks-lag_weeks)])
tibble(week=1:n_weeks, true_rate=true_rate, dashboard=dashboard_rate) |>
pivot_longer(-week) |>
filter(!is.na(value)) |>
mutate(name=recode(name, true_rate="Current (true) rate",
dashboard="Dashboard (2-week lag)")) |>
ggplot(aes(week, value, color=name)) +
geom_line(linewidth=1.1) +
scale_color_manual(values=c("#0891b2","#e63946")) +
scale_y_continuous(labels=scales::percent_format()) +
labs(title="A 2-week ETL lag means the dashboard always shows last month's compliance — not today's",
x="Week", y="CPG compliance rate", color=NULL) +
theme_di()Making OMOP Work: Operational Systems & The Translation Layer
OMOP & Interoperability — Lecture 2 of 2
Jonathan D. Stallings, PhD, MS
Data InDeed | dataindeed.org
2026-01-01
Research databases tolerate ambiguity. Operational systems cannot. OMOP was designed for the first — making it serve the second requires deliberate discipline.
What You’ll Learn Today
Post 04 Trauma-Ready OMOP
- Research vs. operational truth
- Provisional vs. final data
- Episode logic above the CDM
- Latency as a failure mode
- Versioning as governance discipline
Post 05 OMOP as Translation Layer
- Translation ≠ standardization
- Civilian vs. military semantic gaps
- Shared analytic grammar
- Distributed analytics as a real strength
- What OMOP can and cannot do
Part 1
Trauma-Ready OMOP
From research database to operational system
Research vs. Operational Truth
Research database truth:
- Data may be weeks old — acceptable for retrospective study
- Provisional values are fine — they’ll be corrected before analysis
- Ambiguous codes can be resolved during data cleaning
- Missing data handled at analysis time with imputation
- Schema changes tolerated across versions if documented
Example: A 2022 cohort study draws data in 2024. A 90-day lag is irrelevant.
Operational system truth:
- Data must be current — hours, not weeks
- Provisional values must be flagged and tracked through revision
- Ambiguous codes cause wrong real-time decisions
- Missing data must trigger explicit workflow alerts
- Schema changes break running pipelines immediately
Example: A CPG compliance dashboard needs last-night’s operative cases.
The DoDTR modernization challenge: Most OMOP implementations are built for research truth. Trauma registries supporting operational decision-making require operational truth — a fundamentally different set of design choices.
Provisional vs. Final Data: The Required Architecture
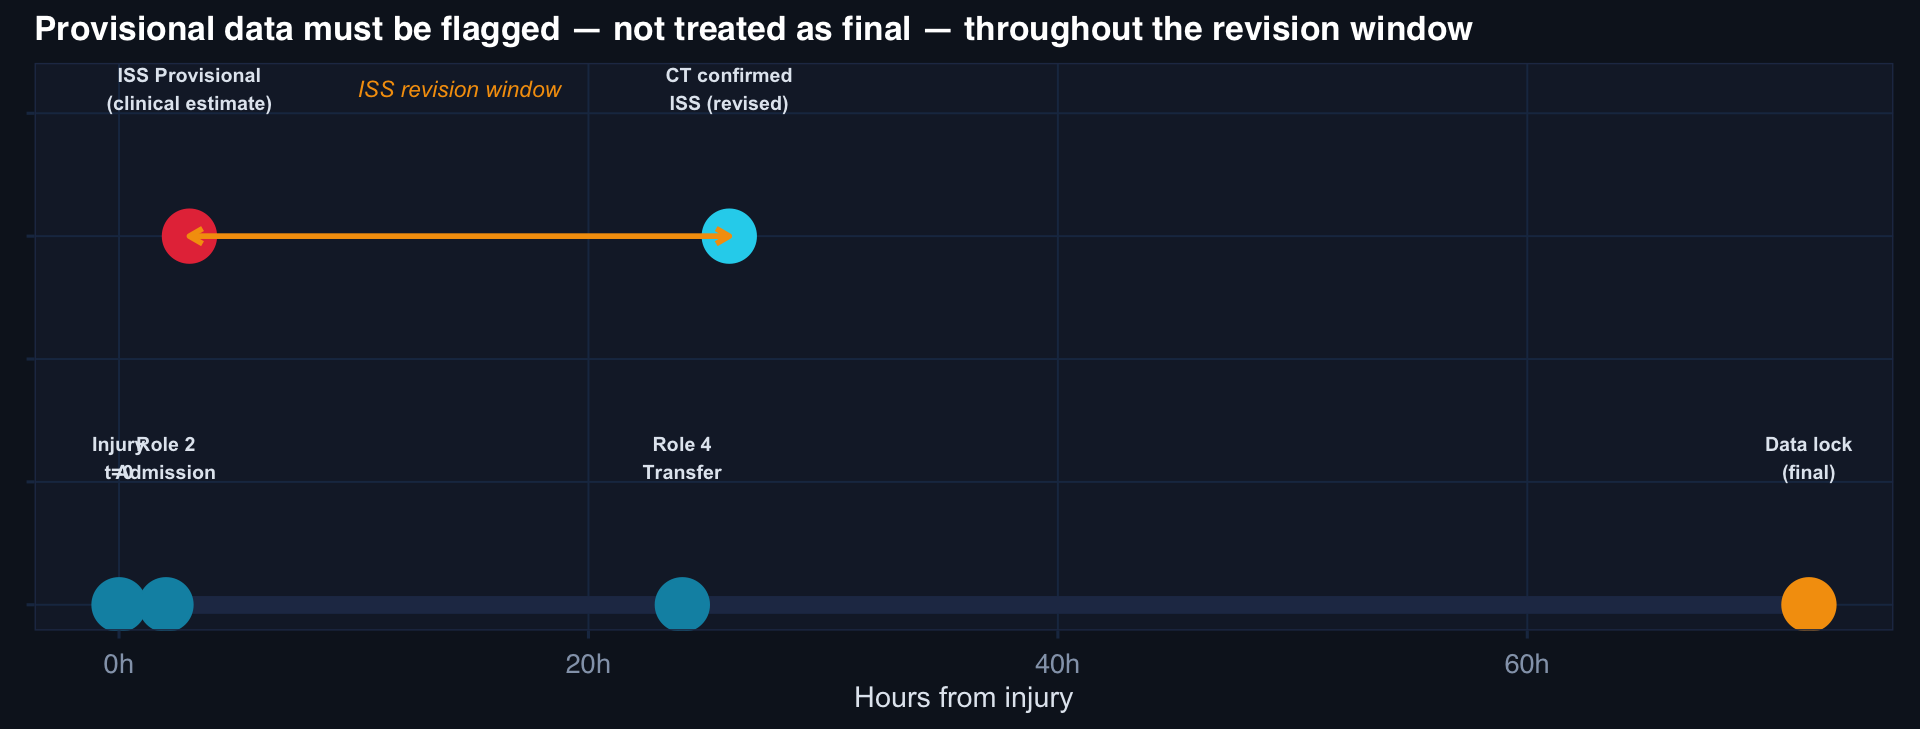
Required OMOP extension: Every trauma-relevant measurement in measurement and observation needs a provenance_flag field: PROVISIONAL | REVISED | FINAL | LOCKED. Without this, dashboards built on the CDM are unreliable until data lock — which may be weeks post-discharge.
Episode Logic: Above the CDM, Not In It
OMOP has no native “trauma episode” concept. You must build it.
-- Trauma episode construction above OMOP CDM
CREATE TABLE trauma_episode AS
SELECT
  e.person_id,
  MIN(vo.visit_start_datetime)   AS episode_start,   -- Point of injury proxy
  MAX(vo.visit_end_datetime)     AS episode_end,      -- Final discharge
  STRING_AGG(vo.visit_concept_id::text, '→'
    ORDER BY vo.visit_start_datetime) AS care_pathway, -- Role sequence
  MAX(m.value_as_number)         AS iss_final,        -- Latest ISS revision
  MAX(CASE WHEN c.concept_code = '419099009'
       THEN 1 ELSE 0 END)        AS died              -- Death in any encounter
FROM episode_linkage_table e           -- ← your governance artifact
JOIN visit_occurrence vo  ON vo.person_id = e.person_id
  AND vo.visit_start_datetime BETWEEN e.injury_datetime
                              AND e.injury_datetime + INTERVAL '30 days'
JOIN measurement m ON m.person_id = e.person_id
  AND m.measurement_concept_id = 4310832  -- ISS
LEFT JOIN condition_occurrence co ON co.person_id = e.person_id
JOIN concept c ON co.condition_concept_id = c.concept_id
GROUP BY e.person_id;
The episode_linkage_table is the governance artifact — it encodes which visits belong to the same episode. This does not exist in the OMOP CDM by default.
Latency: The Hidden Failure Mode
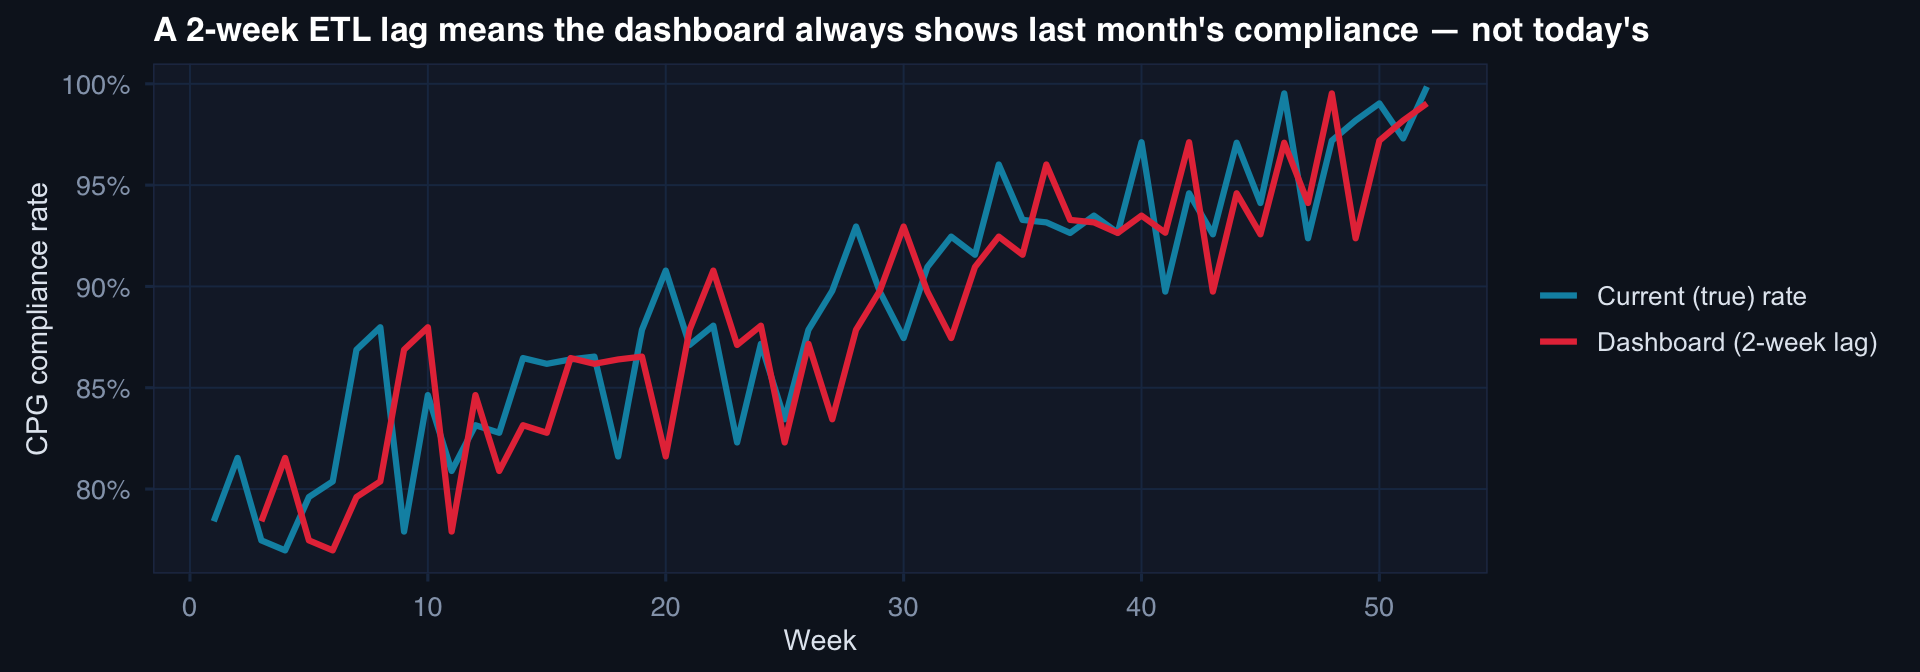
Operational implication: If a compliance rate drops from 84% to 71% in week 48, the commander sees it in week 50. The intervention opportunity is already two weeks stale. For operational registries, ETL pipelines must run daily — or the operational benefit of the analytics disappears.
Part 2
OMOP as Translation Layer
Between civilian and military trauma systems
Translation ≠ Standardization
Standardization assumes a single shared definition that all parties adopt.
Example: Everyone agrees ISS < 15 = minor, 15–24 = moderate, ≥ 25 = severe.
Translation acknowledges that different systems have different definitions — and builds a layer that makes them comparable without erasing the differences.
Example: DoDTR “Role 2 definitive” maps to civilian “Level II trauma center” — but they are not the same. The translation records both, with the mapping rationale and its limitations.
Why the distinction matters: Forced standardization destroys information. Translation preserves source semantics while enabling comparison.
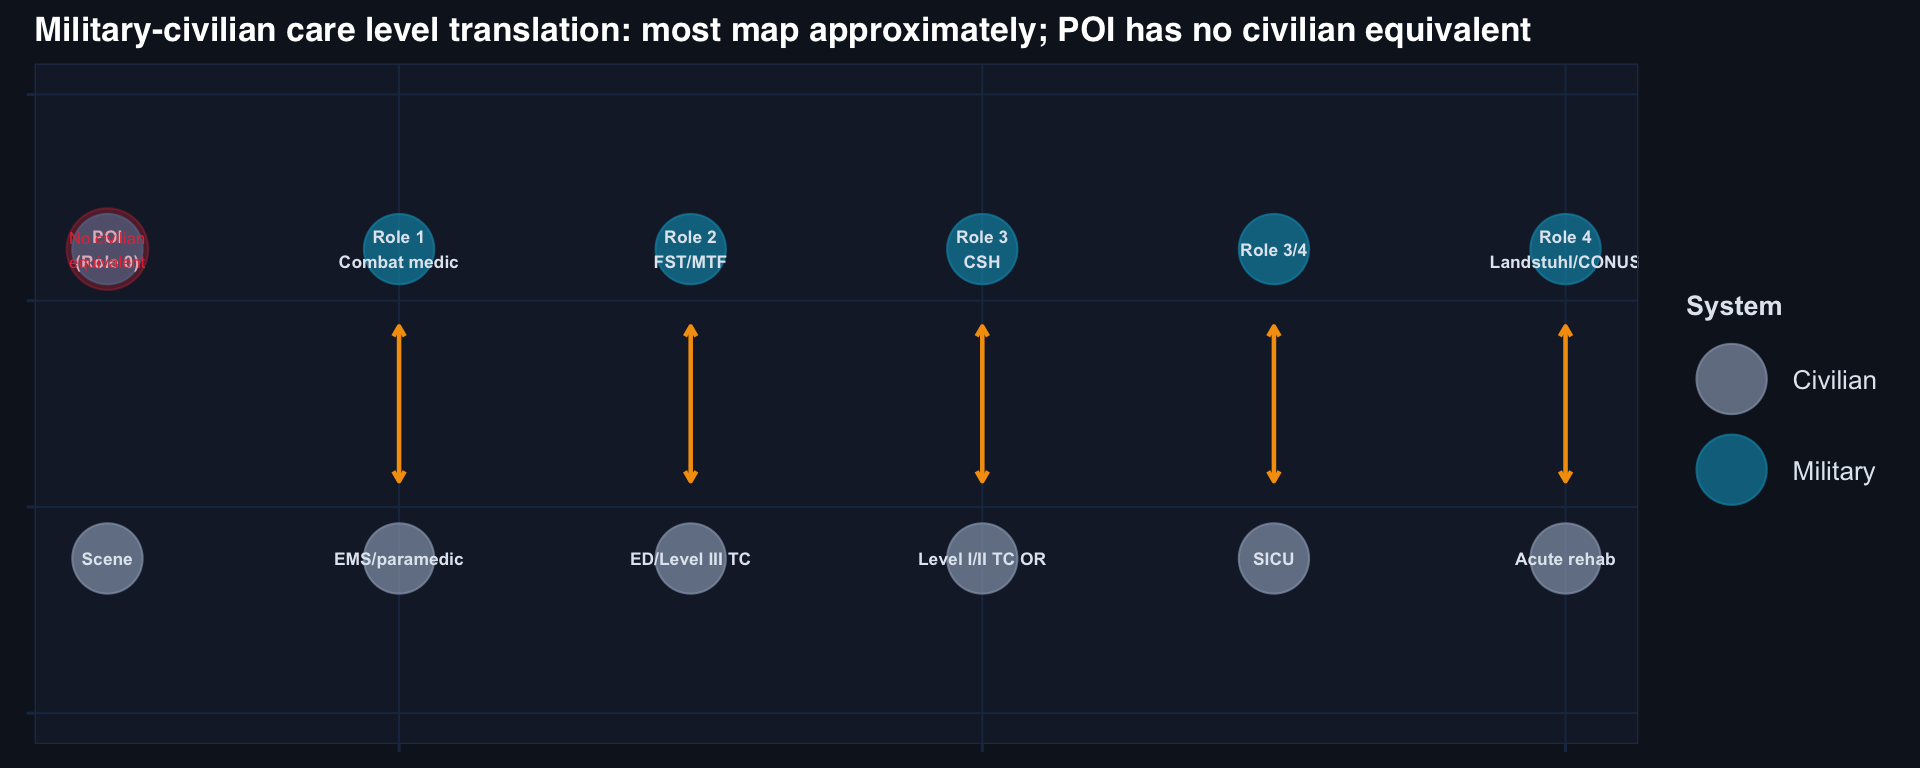
The military-civilian semantic gap:
| Concept | Military | Civilian |
|---|---|---|
| Care level | Role 1–4 | Level I–III TC |
| Time to OR | From point of injury | From hospital arrival |
| “Penetrating” | Includes blast | Often excludes blast |
| Mortality | 30-day from injury | In-hospital |
| Mechanism | Includes IED/SVBIED | No equivalent |
None of these map cleanly. Translation requires explicit documentation of every gap.
The Civilian-Military Semantic Gap
Distributed Analytics: OMOP’s Real Strength
The federated query model:
Each site retains its own data — no PHI transfer. A standardized analytical query runs locally at each site. Only aggregate results are returned.
-- Runs identically at DoDTR, VA, civilian Level I centers
SELECT
  ROUND(AVG(CASE WHEN m.value_as_number >= 25 THEN 1.0 ELSE 0 END), 4)
    AS pct_high_iss,
  COUNT(DISTINCT co.person_id) AS n_patients,
  'SITE_A' AS site_id   -- added by local governance
FROM condition_occurrence co
JOIN measurement m ON m.person_id = co.person_id
  AND m.measurement_concept_id = 4310832  -- ISS
WHERE co.condition_concept_id IN (
  SELECT descendant_concept_id
  FROM concept_ancestor
  WHERE ancestor_concept_id = 4178566  -- Trauma
)
This query produces comparable outputs across sites without anyone sharing patient data.
Why this matters for DoD:
DoDTR, VA, DoD-EHR, AHLTA, and partner nation registries cannot share PHI across systems — classified, HIPAA, and data-sharing agreements all create barriers.
OMOP’s federated model allows a comparative query across all systems, returning aggregate statistics only.
The output is interoperable. The patients never leave their site.
This is one of OMOP’s genuine, irreplaceable contributions — when governance backs it up.
What OMOP Can and Cannot Do
The Governance-Backed Translation Layer
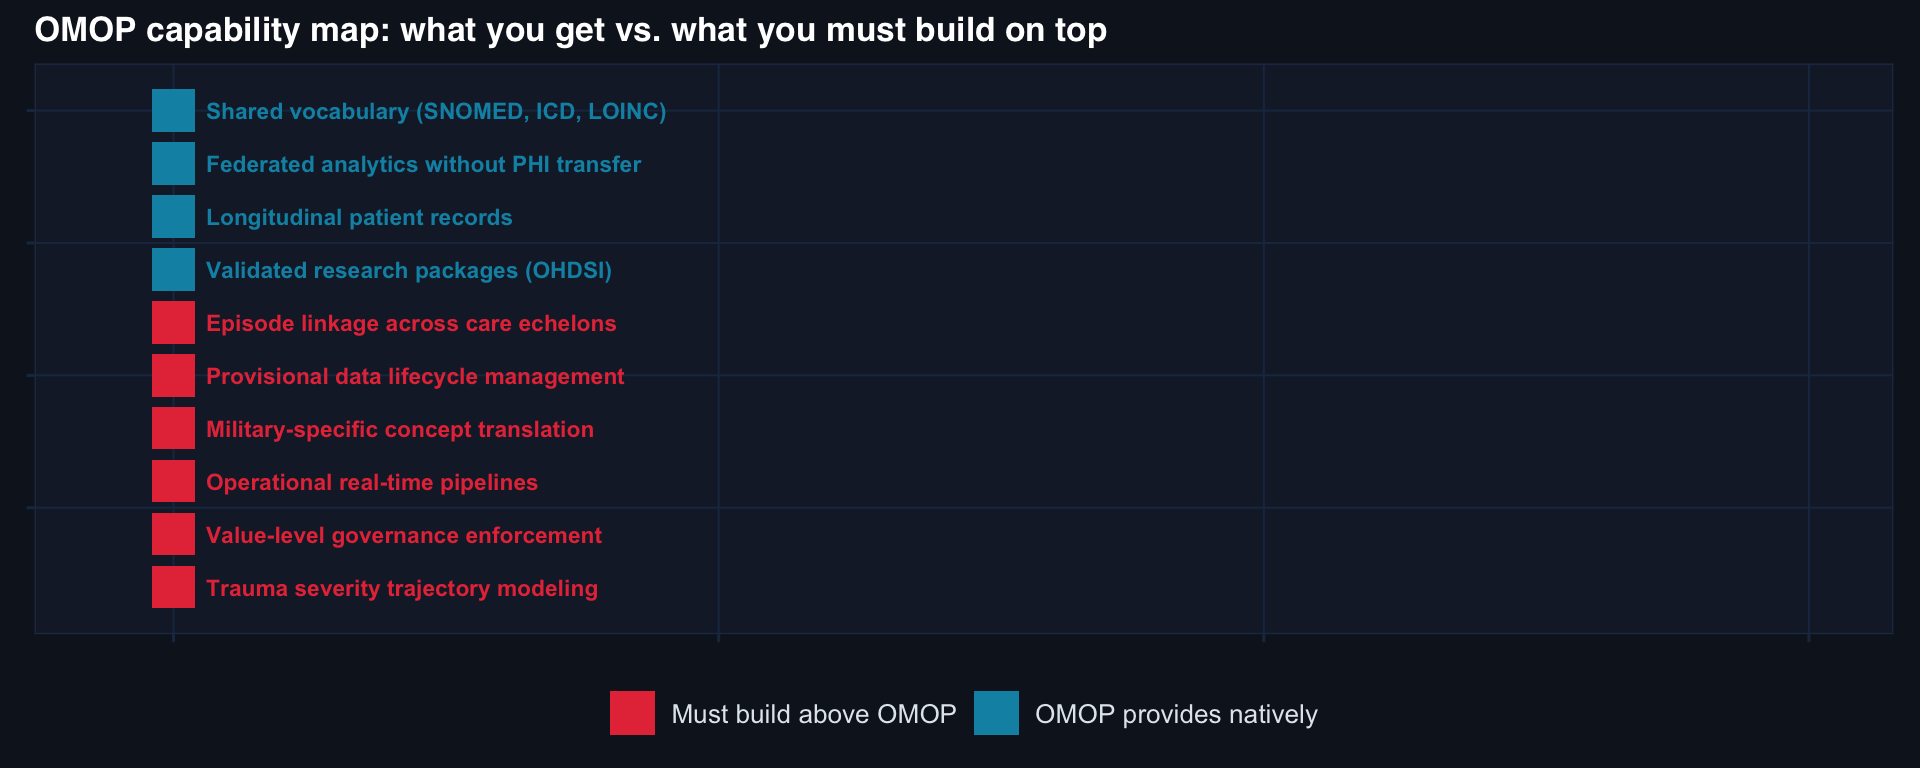
What makes OMOP valuable for military trauma:
OMOP + Value-level dictionaries + Episode linkage governance + Federated query infrastructure + Change-control process
= A translation layer that enables cross-site comparison without pretending that all sites are the same
The four governance artifacts required:
- Value-level data dictionary — for every trauma-relevant field
- Episode linkage table — connecting visits into care pathways
- Site variation registry — documenting known definitional differences
- Change-control log — versioned record of every definition update
Realistic expectation:
OMOP will not “solve” military trauma interoperability. Nothing will. The data is too heterogeneous, the care contexts too different, the governance too distributed.
What OMOP can do: provide a standardized analytic grammar that makes cross-site comparison possible — with explicit, documented, versioned assumptions about where that comparison is valid and where it is not.
That is enormously valuable. It is also genuinely hard to achieve.
OMOP & Interoperability — Series Complete
Lecture 1: OMOP Foundations
- OMOP is built for chronic longitudinal care — trauma compresses what OMOP spreads over years into hours
- One trauma episode fragments into disconnected visits with no native episode linkage
- “OMOP-compliant” means schema + vocabulary — not interoperability
- Value-level metadata is Tier 3: the layer that actually enables comparison
Core artifact: Value-level data dictionary with valid ranges, missing codes, provisional flags, temporal reference, and site variation documentation
Lecture 2: Making OMOP Work
- Research truth ≠ operational truth — fundamentally different design requirements
- Provisional data must be flagged, tracked, and versioned through the revision window
- Episode logic must be built above the CDM — it does not exist natively
- Latency is the hidden failure mode for operational dashboards
- Distributed/federated analytics is OMOP’s irreplaceable contribution
- Translation preserves source semantics; standardization erases them
Core artifact: Episode linkage table + governance backing + federated query infrastructure
Full OMOP Series Reading List
- OMOP Was Built for Longitudinal Care — Trauma Breaks That Assumption
- Interoperability Is a Governance Problem, Not a Data Model Problem
- Why Trauma Registries Need Value-Level Metadata
- From Research Database to Operational System: Making OMOP Trauma-Ready
- OMOP as a Translation Layer Between Civilian and Military Trauma Systems
📚 Go Deeper
OMOP & Interoperability Toolkit — CDM mapping templates, value-level metadata schemas, trauma extension scaffolds, and federated query patterns.
![]()
Data InDeed · OMOP & Interoperability · Lecture 2 | ⚡ Open App